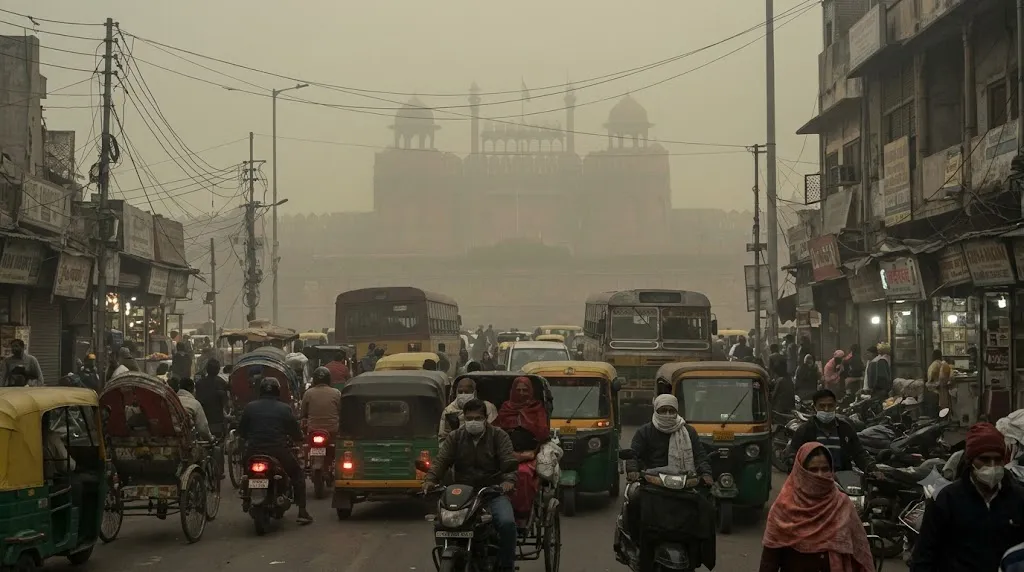
Delhi’s air quality deteriorated further ahead of Diwali, with the city’s 24-hour average Air Quality Index (AQI) reaching 387 on Friday, November 6, 2026. The reading placed the national capital in the very poor category and close to the severe threshold. The pollution situation was particularly concerning across local monitoring stations. Of the 59 active air quality monitoring stations in Delhi, 28 recorded severe pollution levels. Rohini recorded the highest AQI at 473, followed by Punjabi Bagh at 464 and RK Puram at 441. Keep reading to know in detail.
Delhi AQI Today
| Particulars | Details |
| Date of reported AQI | November 6, 2026 |
| Delhi’s average AQI | 387 at 7 am |
| Overall AQI category | Very Poor |
| Active monitoring stations | 59 |
| Stations in severe category | 28 |
| Worst-affected area | Rohini |
| AQI in Rohini | 473 |
| Second-most polluted area | Punjabi Bagh |
| AQI in Punjabi Bagh | 464 |
| Festival approaching | Diwali, November 8, 2026 |
| Pollution-control measures | GRAP restrictions |
Delhi AQI Nears Severe Category Before Diwali
Delhi’s average AQI increased to 387 at 7 am on November 6, compared with 368 at the same time on Thursday. The city’s air quality remained in the very poor category for the fifth consecutive day. The pollution trend showed a steady deterioration at the beginning of the week.
Related Stories
| Date | Delhi AQI | Air Quality Category |
| November 2, 2026 | 324 | Very Poor |
| November 3, 2026 | 350 | Very Poor |
| November 4, 2026 | 377 | Very Poor |
| November 5, 2026 | 368 at 7 am; 369 at 4 pm | Very Poor |
| November 6, 2026 | 387 at 7 am | Very Poor |
The AQI figures in this table are reported readings taken at different times. They should not be treated as identical daily-average measurements.
Which Delhi Areas Recorded Severe AQI?
According to CPCB monitoring data reported on November 6, 28 of Delhi’s 59 active monitoring stations recorded AQI levels in the severe category. Rohini was the most polluted monitoring location, with an AQI of 473. Punjabi Bagh and RK Puram also reported very high pollution levels.
| Monitoring Station | AQI on November 6 | Category |
| Rohini | 473 | Severe |
| Punjabi Bagh | 464 | Severe |
| RK Puram | 441 | Severe |
| Alipur | 435 | Severe |
| Sonia Vihar | 435 | Severe |
| Okhla Phase 2 | 426 | Severe |
| North Campus | 424 | Severe |
| ITO | 420 | Severe |
| Najafgarh | 412 | Severe |
| Anand Vihar | 350 | Very Poor |
| Lodhi Road | 306 | Very Poor |
| Pusa | 393 | Very Poor |
| Chandni Chowk | 386 | Very Poor |
Delhi AQI Latest Update: What Was the Situation on November 7?
Delhi’s air quality showed some improvement in the morning reading on November 7, but pollution remained high. The Delhi live air-quality dashboard reported a citywide AQI of 367 at 5 am. It listed 22 monitoring stations in the severe category, 30 in very poor, seven in poor and none in the good, satisfactory or moderate categories.
| AQI Category | Number of Monitoring Stations on November 7 |
| Good | 0 |
| Satisfactory | 0 |
| Moderate | 0 |
| Poor | 7 |
| Very Poor | 30 |
| Severe | 22 |
| Not reporting | 12 |
The dashboard showed IIT Delhi at 445, Punjabi Bagh West at 434 and Vivek Vihar at 428 among the most polluted reporting locations.
What Do Different AQI Categories Mean?
The Central Pollution Control Board (CPCB) classifies air quality into six categories based on the AQI value.
| AQI Range | Category | General Health Impact |
| 0–50 | Good | Minimal impact |
| 51–100 | Satisfactory | Minor breathing discomfort to sensitive people |
| 101–200 | Moderate | Breathing discomfort to people with lung, asthma or heart conditions |
| 201–300 | Poor | Breathing discomfort to many people on prolonged exposure |
| 301–400 | Very Poor | Respiratory illness may occur on prolonged exposure |
| 401–500 | Severe | Can affect healthy people and seriously affect people with existing diseases |