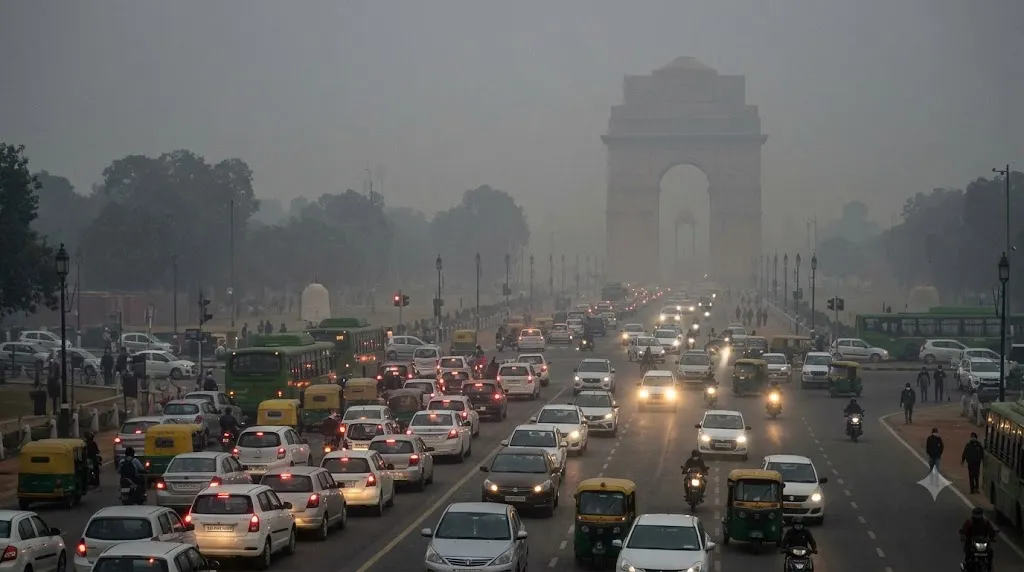
Delhi recorded its cleanest October air in eight years, with the monthly average Air Quality Index (AQI) falling to 166 in October 2026. According to the Union Environment Ministry, this was the lowest average AQI recorded for October since 2018. The improvement came as the capital experienced unusually heavy rainfall during the month. Delhi also recorded 220 days with Good to Moderate air quality between January and October 2026, while the number of days in the Poor to Severe category stood at 84. Keep reading to know in detail.
Delhi Records Average AQI of 166 in October 2026
According to data released by the Union Environment Ministry on October 31, Delhi’s average AQI stood at 166 in October 2026. This was lower than the monthly averages recorded in the previous eight years. The AQI figures show that October 2026 recorded a lower monthly average than October 2021, the previous best in the comparison, when the average was at 173.
Related Stories
| Year | Average AQI in October | Air Quality Category |
| 2026 | 166 | Moderate |
| 2025 | 223 | Poor |
| 2024 | 234 | Poor |
| 2023 | 219 | Poor |
| 2022 | 210 | Poor |
| 2021 | 173 | Moderate |
| 2020 | 265 | Poor |
| 2019 | 234 | Poor |
| 2018 | 269 | Poor |
Delhi AQI Comparison: 2026 Records Improvement Over Previous Years
Delhi’s average AQI of 166 in October 2026 was significantly lower than the 223 recorded in October 2025.
| Comparison | AQI |
| October 2026 | 166 |
| October 2025 | 223 |
| Difference | 57 points lower |
| October 2024 | 234 |
| October 2023 | 219 |
| October 2022 | 210 |
| October 2021 | 173 |
Delhi’s Average AQI Between January and October 2026
The Union Environment Ministry also shared the average AQI for the first ten months of 2026. Delhi’s average AQI for January to October 2026 was 167, compared with 170 during the same period in 2025. The 2020 average was lower at 156.
| Year | Average AQI (January–October) |
| 2026 | 167 |
| 2025 | 170 |
| 2024 | 184 |
| 2023 | 172 |
| 2022 | 187 |
| 2021 | 179 |
| 2020 | 156 |
| 2019 | 192 |
| 2018 | 201 |
Delhi’s PM2.5 and PM10 Levels: What Does the Data Show?
The Ministry also shared particulate matter data for January 1 to October 29, 2026. PM2.5 refers to fine particles with a diameter of 2.5 micrometres or less. These particles can travel deep into the lungs. PM10 refers to particles with a diameter of 10 micrometres or less.
| Year | Average PM2.5 (µg/m³) | Average PM10 (µg/m³) |
| 2026 | 69 | 171 |
| 2025 | 72 | 166 |
| 2024 | 83 | 186 |
| 2023 | 76 | 174 |
| 2022 | 81 | 191 |
| 2021 | 82 | 182 |
| 2020 | 71 | 147 |
| 2019 | 88 | 197 |
| 2018 | 93 | 216 |
The average PM2.5 concentration in 2026 was lower than in every year in the comparison except 2020. However, the average PM10 concentration was higher than in 2025 and 2020.
Heavy Rainfall Helped Reduce Delhi’s Pollution in October
Unusually heavy rainfall was one of the important factors behind Delhi’s improved air quality in October 2026. On October 30, Safdarjung recorded 61.4 mm of rainfall in the 24 hours ending at 8:30 am. This was the sixth-highest 24-hour October rainfall recorded at the station since 1951. The same day, Delhi’s AQI fell to 60, placing it in the Satisfactory category. This was a sharp decline from 222, recorded on October 29.
| Weather and AQI Detail | Recorded Figure |
| Safdarjung rainfall on October 30 (24 hours ending 8:30 am) | 61.4 mm |
| Delhi AQI on October 29 | 222 |
| Delhi AQI on October 30 | 60 |
| One-day AQI decline | 162 points |
| Safdarjung maximum temperature on October 30 | 20.7°C |
| October rainfall at Safdarjung by October 30 | 123.3 mm |
What Is the Difference Between Good, Satisfactory, Moderate and Poor AQI?
The Central Pollution Control Board (CPCB) classifies air quality into six categories based on the AQI value.
| AQI Range | Category | General Description |
| 0–50 | Good | Minimal impact |
| 51–100 | Satisfactory | Minor breathing discomfort to sensitive people |
| 101–200 | Moderate | Breathing discomfort to people with lung, asthma, or heart conditions |
| 201–300 | Poor | Breathing discomfort to most people on prolonged exposure |
| 301–400 | Very Poor | Respiratory illness risk on prolonged exposure |
| 401–500 | Severe | Health impacts even on healthy people and serious effects on people with existing diseases |