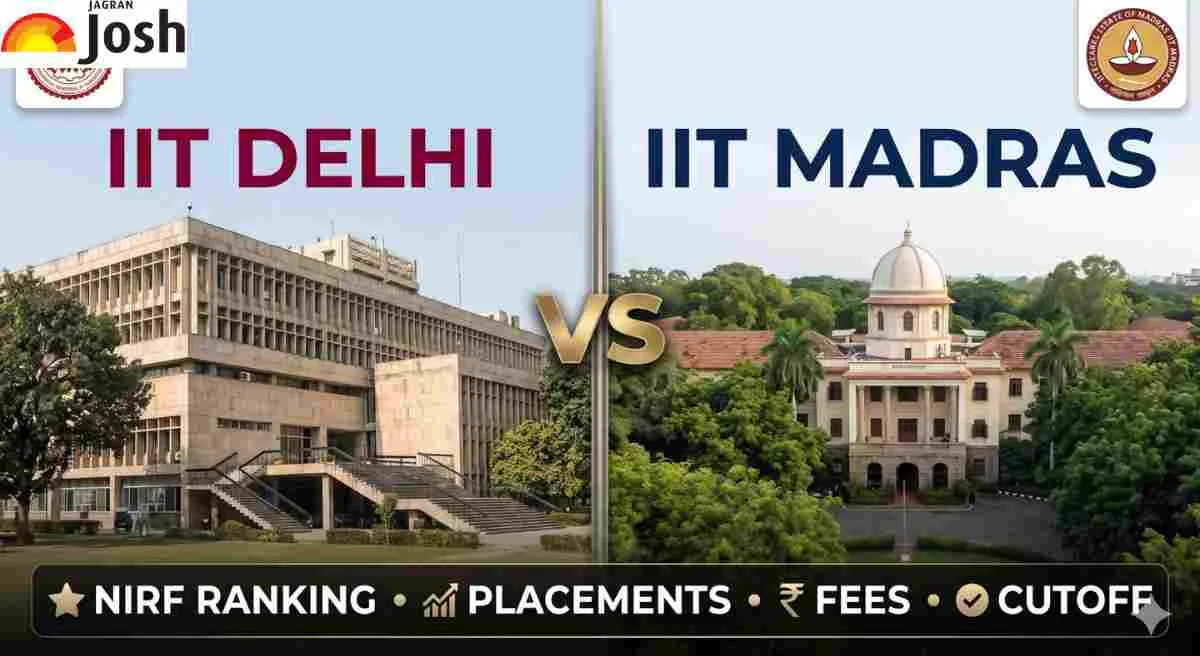
IIT Delhi vs IIT Madras: Choosing between Indian Institute of Technology (IIT) Delhi and Indian Institute of Technology (IIT) Madras, which are India’s finest two engineering colleges, depends on personal preference about location, branches, and career prospects. IIT Madras ranks #1 nationally in NIRF Engineering, with its globally recognized Research Park and strong emphasis on deep technology, hardware innovation, and interdisciplinary studies. IIT Delhi ranks #2 nationally due to its proximity to the capital region and thus provides excellent exposure to industry and good startup incubators and corporate connections. The admission to both the institutes necessitates outstanding JEE Advanced scores, wherein cutoffs for Computer Science and Engineering (CSE) branch tend to be closed in All India Ranks (AIR) range of 1-120 for IIT Delhi and 1-150 for IIT Madras.
Both the campuses have immaculate campus recruitment records, with average salary packages of above ₹20 LPA overall, with CSE average offers ranging above ₹35-50 LPA along with attractive foreign job opportunities.
IIT Delhi vs IIT Madras: The Overall Data
These three comparison tables provide the details of the overall description, placements figures, and the JEE Advanced cut-off marks for the two colleges.
Related Stories
IIT Delhi vs. IIT Madras: Overview
While IIT Madras leads in institutional standing with NIRF Rank 1 across Engineering and overall categories, IIT Delhi reports slightly higher placement metrics, including placement rate (85%–90%), median package (₹19.08 LPA), and overall average package (₹25.82 LPA). Both institutes maintain identical semester tuition fees (₹1.00 Lakh) and highly competitive JEE Advanced CSE cutoff ranks (AIR 123 vs. AIR 151).
|
Feature
|
IIT Delhi
|
IIT Madras
|
|---|---|---|
|
NIRF Engineering Rank (2025)
|
Rank 2 (Score: 85.74)
|
Rank 1 (Score: 88.72)
|
|
NIRF Overall Rank (2025)
|
Rank 4 (Score: 80.67)
|
Rank 1 (Score: 87.31)
|
|
B.Tech Placement Rate
|
85% – 90%
|
80% – 85%
|
|
B.Tech Median Package
|
₹19.08 LPA
|
₹17.78 LPA
|
|
B.Tech Average Package (Overall)
|
₹25.82 LPA
|
₹22.00 LPA
|
|
Highest Domestic Package
|
₹1.80 Crore – ₹2.00 Crore+ / Annum
|
₹1.98 Crore / Annum
|
|
Semester Tuition Fee (General / OBC)
|
₹1,00,000 / semester
|
₹1,00,000 / semester
|
|
JEE Advanced CSE Closing Rank (Open GN)
|
AIR 123
|
AIR 151
|
|
Overall B.Tech Cutoff Rank Range
|
AIR 24 – AIR 6,580
|
AIR 79 – AIR 6,454
|
Also Read: IIT Bombay vs IIT Delhi: Fees, Branch-Wise Placements, Top Recruiters
B.Tech Placement Statistics Comparison:
While IIT Delhi reports higher overall undergraduate outcomes including median (₹19.08 LPA) and average packages (₹25.82 LPA) along with more students placed (1,140+) IIT Madras leads significantly in top-end computer science metrics. IIT Madras achieves a higher CSE average (₹53.20 LPA), CSE median (₹46.00 LPA), and peak international offer (₹4.30 Crore PPO).
|
Placement Metric
|
IIT Delhi
|
IIT Madras
|
|---|---|---|
|
Overall B.Tech Median Package (4-Year)
|
₹19.08 LPA
|
₹17.78 LPA
|
|
Overall B.Tech Average Package
|
₹25.82 LPA
|
₹22.00 LPA
|
|
B.Tech CSE Average Package
|
₹34.00 LPA – ₹49.00 LPA
|
₹53.20 LPA
|
|
B.Tech CSE Median Package
|
₹30.00 LPA
|
₹46.00 LPA
|
|
Highest Domestic Package
|
₹1.80 Crore / Annum
|
₹1.98 Crore / Annum
|
|
Highest International Package
|
₹2.00 Crore+ / Annum
|
₹4.30 Crore / Annum (PPO)
|
|
Total Registered / Eligible Students
|
1,200+
|
1,200+ (UG/DD)
|
|
Students Placed
|
1,140+
|
1,091+
|
|
Top Sector Recruiters
|
Core Tech, Quant, IT, Analytics
|
Core Engineering, Software, Data Science
|
JEE Advanced Cutoff Rank Ranges (Open Category, Gender-Neutral)
In JEE Advanced, IIT Delhi features tighter admission limits for Computer Science (AIR 24–123), whereas IIT Madras extends slightly wider across both CSE (AIR 79–151) and overall branches (AIR 79–6,454).
|
College
|
B.Tech Computer Science (CSE) Cutoff Range
|
Overall B.Tech Cutoff Range (All Branches)
|
|---|---|---|
|
IIT Delhi
|
AIR 24 – AIR 123
|
AIR 24 – AIR 6,580
|
|
IIT Madras
|
AIR 79 – AIR 151
|
AIR 79 – AIR 6,454
|
What the Data Shows
1. NIRF Leadership vs. Student Preference
IIT Madras has its firm hold on the NIRF Engineering ranking at No. 1 with an aggregate score of 88.72 over IIT Delhi’s 85.74. The edge of IIT Madras comes primarily from the performance in research project output and faculty resource utilization. But when we come to the preferences of JEE Advanced toppers, we see that their inclination is more towards IIT Delhi where CSE cut-off is AIR 123, against 151 for IIT Madras.
2. Placement Compensation Highlights
Although both these institutions have excellent placement statistics, the difference is visible through their branch strengths:
-
Overall Median Package: The overall median package for B.Tech from IIT Delhi is slightly better than that of IIT Madras with ₹19.08 LPA to ₹17.78 LPA, respectively.
-
Highly Paid CSE Branch: IIT Madras has impressive CSE branch statistics, having an average of ₹53.20 LPA and a median salary of ₹46.00 LPA because of lucrative pay packages for abroad and core software companies.
-
Highest Domestic Salary: Both these colleges have highest salaries among domestic recruiters in the range of ₹1.80 Crore to ₹2.00 Crore per annum for Quantitative Trading and HFT companies.
3. Uniform Fee Structures
Both being central autonomous institutions, IIT Delhi and IIT Madras follow government guidelines regarding the undergraduate fee structure and charge a basic tuition fee of Rs. 1,00,000 per semester for candidates belonging to General and OBC categories.
The Takeaway
Both IIT Delhi and IIT Madras represent the absolute pinnacle of engineering education in India. IIT Madras stands out for academic research infrastructure, institutional scale, and NIRF dominance. On the other hand, IIT Delhi offers a slight edge in overall median compensation across all B.Tech streams combined and remains a preferred destination for top 100 JEE Advanced rankers.
Also Read:Top 10 Private B.Tech Colleges in Maharashtra: Fees, Key Courses & Admission Eligibility
IIT Delhi NIRF Ranking 2026: Check Complete 5 year Rank Analysis Here