
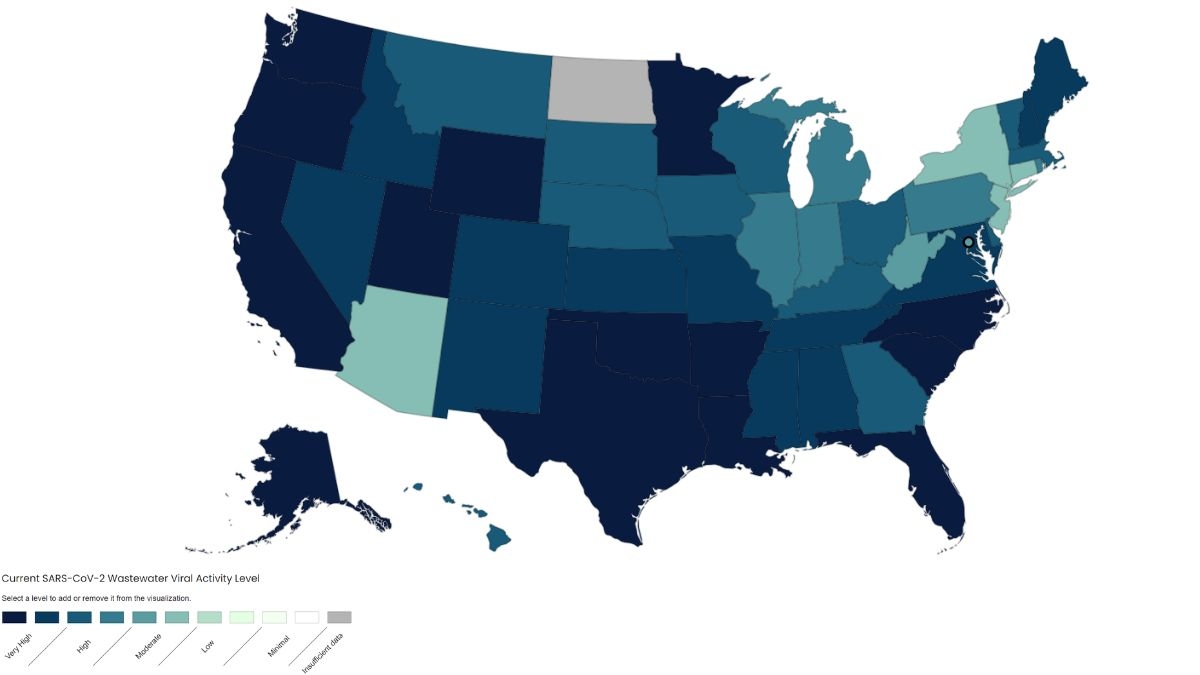
A significant majority of US states are grappling with alarming levels of COVID-19 in their wastewater, indicating a persistent and widespread surge in virus cases. Currently, 27 states are reporting extremely high levels, while 17 states are seeing high levels of viral activity in wastewater. The western region is bearing the brunt, followed closely by the South, Midwest, and Northeast, in that order, highlighting a concerning trend of escalating virus transmission across the country.
Current viral activity levels of SARS-COV-2 in Wastewater
Current levels are nearing but remain lower than what they were in the winter months when there tends to be an increased spread of respiratory illnesses. Wastewater data comes with limitations in how well it represents spread in a community, but it may be the best data available, experts say. Check the table below:
| Date | National | Midwest | South | Northeast | West |
| 08/03/24 | 9.01 | 7.2 | 11.78 | 5.13 | 13.5 |
| 07/27/24 | 7.18 | 5.91 | 9.93 | 4.18 | 10.89 |
| 07/20/24 | 6.48 | 5.06 | 8.42 | 3.92 | 10.33 |
| 07/13/24 | 5.98 | 4.51 | 6.7 | 3.46 | 10.45 |
| 07/06/24 | 4.66 | 3.25 | 5.21 | 2.84 | 7.55 |
| 06/29/24 | 3.94 | 2.87 | 4.27 | 2.66 | 7.28 |
| 06/22/24 | 3.02 | 2.43 | 3.34 | 1.8 | 6.71 |
| 06/15/24 | 2.45 | 2.13 | 2.46 | 1.63 | 4.79 |
| 06/08/24 | 2.19 | 1.82 | 2.05 | 1.29 | 4.56 |
| 06/01/24 | 1.93 | 1.71 | 1.89 | 1.31 | 3.5 |
| 05/25/24 | 1.69 | 1.45 | 1.6 | 1.35 | 2.85 |
| 05/18/24 | 1.56 | 1.37 | 1.41 | 1.33 | 2.3 |
| 05/11/24 | 1.4 | 1.4 | 1.34 | 1.26 | 1.73 |
| 05/04/24 | 1.36 | 1.48 | 1.34 | 1.28 | 1.3 |
| 04/27/24 | 1.39 | 1.52 | 1.41 | 1.21 | 1.39 |
| 04/20/24 | 1.54 | 1.75 | 1.6 | 1.44 | 1.32 |
| 04/13/24 | 1.84 | 2.22 | 2.07 | 1.58 | 1.36 |
| 04/06/24 | 2.1 | 2.24 | 2.63 | 1.59 | 1.75 |
| 03/30/24 | 2.44 | 2.64 | 2.77 | 1.77 | 1.77 |
| 03/23/24 | 2.53 | 2.64 | 3.14 | 1.78 | 2.28 |
| 03/16/24 | 2.99 | 3.18 | 4.04 | 1.69 | 2.66 |
| 03/09/24 | 4.12 | 4.69 | 5.26 | 2.31 | 3.37 |
| 03/02/24 | 4.97 | 6.25 | 7.41 | 3.58 | 3.56 |
| 02/24/24 | 5.88 | 6.54 | 8.91 | 4.3 | 4.56 |
| 02/17/24 | 6.51 | 7.16 | 9.35 | 5.38 | 5.5 |
| 02/10/24 | 6.9 | 6.79 | 9.54 | 5.7 | 6.46 |
The Wastewater Viral Activity Levels are categorised into minimal, low, moderate, high, or very high as follows:
- Less than 1.5 – Minimal
- Greater than 1.5 and up to 3 – Low
- Greater than 3 and up to 4.5 – Moderate
- Greater than 4.5 and up to 8 – High
- Greater than 8 – Very High
According to CDC data, other limited COVID-19 monitoring systems, including emergency department visits and test positivity rates, are also increasing. However, deaths from the virus have remained relatively stable, especially when compared to previous years.
Check the Covid map below:
Federal health authorities have announced that updated COVID-19 vaccines will be available this fall. The U.S. Food and Drug Administration has advised vaccine manufacturers to develop shots targeting the KP.2 strain, a subvariant of omicron, which currently accounts for approximately 6% of cases.


-1762770723412.jpg)

Comments
All Comments (0)
Join the conversation