
Cats vs. Dogs States In US: Americans love their pets. There are an estimated 90 million pet dogs and 86 million pet cats in the United States. In fact, 67% of households in the United States own a pet, and of those, 63% own dogs and 37% own cats.
5 Personality Traits of Mentally Strong People
Below, we have gathered information on the US states that are either dog states, cat states, or both based on data and insights from the Pet Ownership and Demographics Sourcebook by the American Veterinary Medical Association.
List of Cats vs. Dogs States In The US
Below is the list of which US states love dogs the most and which US states love cats the most.
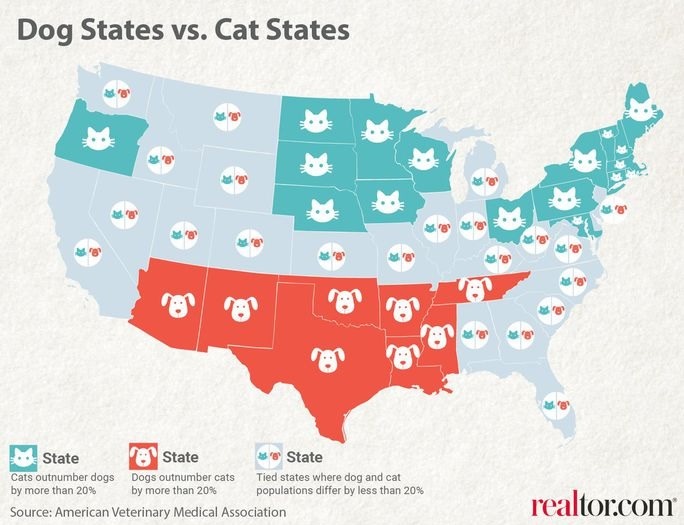
Dog states in the US
- Arizona
- New Mexico
- Texas
- Oklahoma
- Arkansas
- Louisiana
- Mississippi
- Tennessee
Cat states in the US
- Oregon
- North Dakota
- South Dakota
- Nebraska
- Minnesota
- Iowa
- Wisconsin
- Maine
- New Hampshire
- Vermont
- Massachusetts
- Rhode Island
- Connecticut
- Maryland
- New York
- Pennsylvania
- Ohio
US States That Are Both Dog State and Cat State
- Washington
- Montana
- Idaho
- Nevada
- California
- Utah
- Wyoming
- Colorado
- Kansas
- Missouri
- Illinois
- Indiana
- Kentucky
- West Virginia
- Virginia
- North Carolina
- South Carolina
- Georgia
- Alabama
- Florida
Also try: Test Your Vision: Spot A Beetle In This Optical Illusion Image In 7 Seconds?
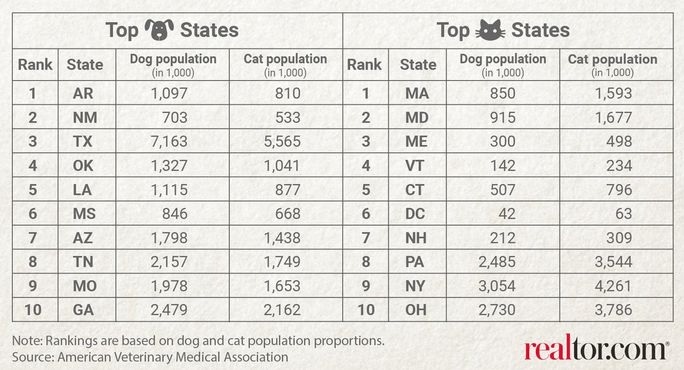
Top 10 Dog States vs. Top 10 Cat States
Let us also look at the US states that rank on the list of top 10 dog states and cat states. The list has been prepared from the rankings based on dog and cat population proportions data by the American Veterinary Medical Association.
Arizona tops the list of dog states whereas Massachusetts ranks first among cat states in the US.
Also try: You Have 8K Vision If You Can Spot A Spider In This Messy Room In 7 Seconds!
Cat States vs. Dog States (US Map)
As per the cat states vs. dog states map comparison, we can visually see which US states love dogs the most while the US states which love cats the most. States that are highlighted with both dog and cat icons share a love for both pets.
Pet Ownership Statistics In The US At A Glance
Let us look at the latest facts and figures on pet ownership in the US as per the Pet Ownership and Demographics Sourcebook by the American Veterinary Medical Association.
- As of 2023, about 66% of US households own a pet compared to 56% in 1988.
- Approximately 65.1 million US households own a dog while 46.5 million US households own a cat.
- In 2022, Americans spent $136.8 billion on their pets. More than 5,000 US dog owners spend an average of $730 a year on their dogs, found a Forbes Advisor survey.
- Among all the generations, millennials comprise the highest percentage of pet owners in the US.
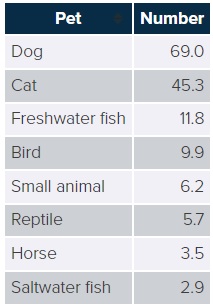
Number of US Households That Own Pets (by animal type)
American Pet Products Association's 2021-2022 National Pet Owners Survey revealed the number of US households (in millions) that own a pet. Below, we have provided the table for each type of animal as a pet. Most popular pets in US households include dogs (69 million households), followed by cats (45.3 million households) and freshwater fish (11.8 million households).
Hope you enjoyed reading this interesting article.
Also read: Personality Test: Your Lip Shape Reveals Your Hidden Personality Traits
Also read: Personality Test: Your Thumb Reveals Your Hidden Personality Traits


Comments
All Comments (0)
Join the conversation