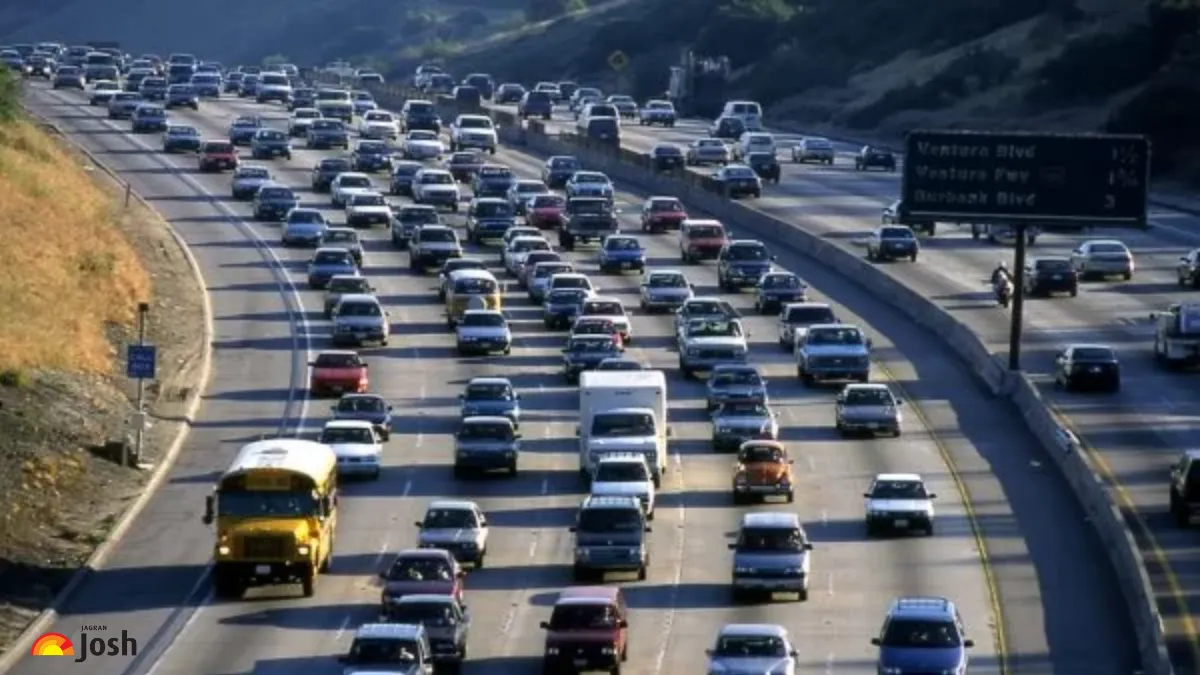
Urban traffic congestion is a spreading issue for cities globally, affecting daily travel times, economic productivity, and overall quality of life. The latest report from TomTom Traffic Index, following statistics from more than 600 million connected devices, scores cities based on average travel time every 10 kilometers, congestion, and hours lost in traffic per year. Below is an in-depth review of the world's slowest moving cities for drivers.
The most congested cities have high population density, fast urbanization, old infrastructure, and a rise in car ownership. All these factors come together to form traffic jams, particularly during rush hours, causing even short trips to become time-consuming.
The Top 10 Slowest Cities
| Rank | City, Country | Avg. Travel Time (per 10 km) | Congestion Level (%) | Annual Time Lost (hours) |
| 1 | Barranquilla, Colombia | 36 min 6 sec | 45 | 130 |
| 2 | Kolkata, India | 34 min 33 sec | 32 | 110 |
| 3 | Bengaluru, India | 34 min 10 sec | 38 | 117 |
| 4 | Pune, India | 33 min 22 sec | 34 | 108 |
| 5 | London, UK | 33 min 17 sec | 32 | 113 |
| 6 | Kyoto, Japan | 33 min 16 sec | 39 | 95 |
| 7 | Lima, Peru | 33 min 12 sec | 47 | 155 |
| 8 | Davao City, Philippines | 32 min 59 sec | 49 | 136 |
| 9 | Trujillo, Peru | 32 min 56 sec | 34 | 102 |
| 10 | Dublin, Ireland | 32 min 45 sec | 47 | 155 |
1. Barranquilla, Colombia
-
Average travel time per 10 km: 36 min 6 sec
-
Congestion level: 45%
-
Annual time lost: 130 hours
Barranquilla leads the world rankings, with motorists taking more than 36 minutes to travel a mere 10 kilometers. Although there has been some relief from last year, congestion is still a main problem, particularly at peak times.
2. Kolkata, India
-
Average travel time per 10 km: 34 min 33 sec
-
Congestion level: 32%
-
Annual time lost: 110 hours
Kolkata’s narrow lanes and aging infrastructure contribute to its position as the second slowest city. Commuters face long delays, particularly in the city center.
3. Bengaluru, India
-
Average travel time per 10 km: 34 min 10 sec
-
Congestion level: 38%
-
Annual time lost: 117 hours
Known as India’s tech hub, Bengaluru’s rapid growth has outpaced its infrastructure, resulting in severe traffic bottlenecks and increased travel times.
4. Pune, India
-
Average time to travel per 10 km: 33 min 22 sec
-
Level of congestion: 34%
-
Time lost annually: 108 hours
Pune continues to be one of the slower cities, but with a bit of an improvement in travel times this year compared to the previous year.
5. London, United Kingdom
-
Average time to travel per 10 km: 33 min 17 sec
-
Congestion level: 32%
-
Time lost annually: 113 hours
London is the slowest European city, and drivers waste considerable time each day because of jams, particularly in the city center.
6. Kyoto, Japan
-
Average travel time per 10 km: 33 min 16 sec
-
Congestion level: 39%
-
Annual time lost: 95 hours
The traditional layout of Kyoto and the high tourist arrival make it a slow-moving city, especially during peak travel periods.
7. Lima, Peru
-
Average travel time per 10 km: 33 min 12 sec
-
Congestion level: 47%
-
Annual time lost: 155 hours
Lima's congestion is one of the worst in the world, with drivers losing over six days a year stuck in traffic.
8. Davao City, Philippines
-
Average travel time per 10 km: 32 min 59 sec
-
Congestion level: 49%
-
Annual time lost: 136 hours
Davao City's fast urbanization and restricted road expansion caused severe delays for commuters.
9. Trujillo, Peru
Average travel time per 10 km: 32 min 56 sec
Congestion level: 34%
Annual lost time: 102 hours
Trujillo has the same issues as Lima, high congestion and low speeds.
10. Dublin, Ireland
Average travel time per 10 km: 32 min 45 sec
Congestion level: 47%
Annual lost time: 155 hours
Key Insights
-
Indian cities lead the top 10, which mirrors the pressing requirement for infrastructure improvement and improved urban planning.
-
Latin American urban areas such as Barranquilla, Lima, and Trujillo experience chronic congestion as a result of fast-paced urban development and narrow road networks.
-
Even European and Asian cities like London, Kyoto, and Dublin have their problems with congestion, frequently caused by historic urban planning and high population.
The TomTom Traffic Index 2024 reveals the international character of city congestion. Overcoming these issues calls for concerted actions in public transportation investment, intelligent traffic management, and green urban planning. As cities expand further, creative solutions will be critical to keep economies and people on the move.


-1764429046818.jpg)
Comments
All Comments (0)
Join the conversation