In 2024, the US housing market is experiencing a significant upswing, with property values surging across almost every state in the country. As of the first quarter of 2024, home prices have seen a remarkable 6.6% year-over-year increase, the largest jump since 2022. This notable rise is fueled by a perfect storm of factors, including a severe shortage of homes for sale and a widespread hesitation among homeowners to put their properties on the market, all against the backdrop of persistently high interest rates.
ALSO READ| List of US States by Area
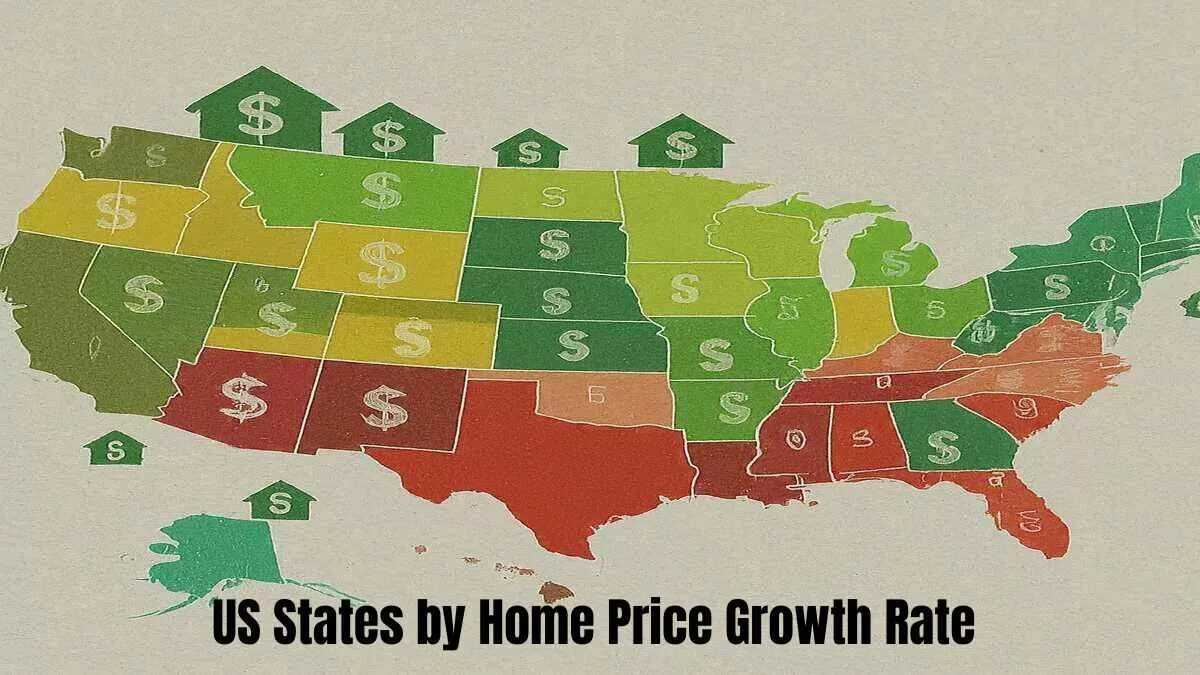
States by Home Price Growth Rate 2024
Between the first quarter of 2023 and 2024, a nationwide upswing in housing prices swept across all 50 states. The top five states with the most remarkable annual growth were Vermont, leading the pack with a 12.8% surge, followed closely by New Jersey's 11.6% increase, New York's 10.9% rise, Delaware's 10.7% climb, and Wisconsin's 9.9% boost. Here is the complete list:
| Rank | State | 1-Yr | Qtr | 5-Yr | Since 1991Q1 |
| 1 | Vermont (VT) | 12.80% | 3.33% | 73.31% | 314.91% |
| 2 | New Jersey (NJ) | 11.58% | 2.20% | 66.50% | 293.50% |
| 3 | New York (NY) | 10.87% | 2.08% | 59.24% | 286.76% |
| 4 | Delaware (DE) | 10.73% | 3.19% | 65.61% | 229.47% |
| 5 | Wisconsin (WI) | 9.94% | 2.46% | 62.84% | 327.81% |
| 6 | Kansas (KS) | 9.91% | 2.57% | 58.27% | 289.37% |
| 7 | Connecticut (CT) | 9.64% | 0.77% | 62.87% | 179.88% |
| 8 | Illinois (IL) | 9.38% | 2.05% | 47.96% | 196.09% |
| 9 | New Hampshire (NH) | 9.37% | 1.81% | 74.75% | 342.54% |
| 10 | Maine (ME) | 9.12% | 3.56% | 81.58% | 364.18% |
| 11 | Massachusetts (MA) | 8.85% | 1.53% | 55.36% | 348.31% |
| 12 | South Carolina (SC) | 8.47% | 1.59% | 73.78% | 327.30% |
| 13 | Rhode Island (RI) | 8.47% | 0.86% | 69.27% | 296.14% |
| 14 | Nevada (NV) | 8.08% | 2.47% | 53.67% | 310.51% |
| 15 | Indiana (IN) | 8.04% | 1.31% | 62.20% | 245.89% |
| 16 | Ohio (OH) | 8.03% | 1.00% | 60.99% | 225.27% |
| 17 | Pennsylvania (PA) | 7.92% | 1.84% | 52.88% | 247.38% |
| 18 | Michigan (MI) | 7.79% | 0.42% | 56.88% | 258.17% |
| 19 | Hawaii (HI) | 7.77% | 6.00% | 55.14% | 297.42% |
| 20 | Missouri (MO) | 7.60% | 1.51% | 60.22% | 281.46% |
| 21 | Georgia (GA) | 7.27% | 1.21% | 71.81% | 313.84% |
| 22 | Nebraska (NE) | 7.14% | 2.90% | 56.38% | 315.45% |
| 23 | New Mexico (NM) | 7.04% | 3.25% | 61.16% | 295.49% |
| 24 | Maryland (MD) | 6.95% | 1.30% | 44.63% | 255.61% |
| 25 | California (CA) | 6.28% | 0.78% | 50.04% | 321.04% |
| 26 | Florida (FL) | 6.13% | 0.54% | 80.65% | 459.42% |
| 27 | Oklahoma (OK) | 6.00% | 1.72% | 53.71% | 272.57% |
| 28 | Tennessee (TN) | 5.95% | 1.18% | 75.14% | 366.70% |
| 29 | Utah (UT) | 5.79% | 1.28% | 68.66% | 606.37% |
| 30 | North Carolina (NC) | 5.79% | 0.71% | 74.78% | 324.41% |
| 31 | Virginia (VA) | 5.73% | 0.32% | 54.52% | 296.29% |
| 32 | Kentucky (KY) | 5.60% | 0.95% | 56.13% | 274.10% |
| 33 | Iowa (IA) | 5.44% | 1.18% | 44.13% | 255.06% |
| 34 | Montana (MT) | 5.15% | 1.22% | 78.51% | 601.57% |
| 35 | Arkansas (AR) | 5.15% | 0.85% | 57.94% | 249.88% |
| 36 | Washington (WA) | 5.12% | 0.99% | 57.27% | 476.14% |
| 37 | Arizona (AZ) | 4.94% | -1.08% | 74.63% | 461.42% |
| 38 | Minnesota (MN) | 4.79% | 1.44% | 41.94% | 312.38% |
| 39 | Alaska (AK) | 4.66% | 0.74% | 39.22% | 260.58% |
| 40 | Idaho (ID) | 4.60% | 2.73% | 82.03% | 529.53% |
| 41 | South Dakota (SD) | 4.27% | 0.91% | 59.18% | 380.42% |
| 42 | Wyoming (WY) | 4.07% | 1.93% | 51.81% | 417.47% |
| 43 | Oregon (OR) | 3.96% | 1.62% | 47.73% | 528.46% |
| 44 | West Virginia (WV) | 3.64% | -5.73% | 37.80% | 200.46% |
| 45 | Colorado (CO) | 3.61% | -0.04% | 50.55% | 587.41% |
| 46 | Texas (TX) | 3.34% | 0.95% | 54.02% | 345.19% |
| 47 | North Dakota (ND) | 3.30% | -0.26% | 30.48% | 313.07% |
| 48 | Alabama (AL) | 3.15% | 0.08% | 57.97% | 251.40% |
| 49 | Mississippi (MS) | 2.73% | -4.19% | 46.00% | 203.24% |
| 50 | Louisiana (LA) | 2.23% | -0.56% | 28.34% | 257.38% |
| 51 | District of Columbia (DC) | -1.53% | 0.84% | 18.89% | 511.21% |
Washington, D.C. stood out as the sole exception, experiencing a slight downturn in housing prices. As of Q1 2024, home values in the district dipped by 1.5% year-over-year. This decline may be attributed to the area's reputation as one of the nation's priciest housing markets, leading some potential buyers to adopt a wait-and-see approach until interest rates become more favourable. Additionally, a significant portion of homes in the area - over 20% as of January 2024 - carry price tags exceeding $1.5 million, which may be contributing to the moderation in prices.
ALSO READ| The 10 Longest Rivers in North America: Majestic Waterways Teeming with Life
The data is derived from the Federal Housing Finance Agency House Pricing Index (FHFA HPI), a comprehensive database that thoroughly analyses house price indexes, dating back to the 1970s. This index covers all 50 states, and over 400 cities, and incorporates data from millions of home sales, providing valuable insights into house price fluctuations across various levels, including national, state, metropolitan, county, ZIP code, and census tract. The FHFA employs a transparent methodology based on a weighted, repeat-sales statistical technique to examine house price transaction data.
ALSO READ| List Of Top 50 U.S. States By Educational Attainment
ALSO READ| 10 Least Populated States In US 2024
ALSO READ| Top 10 Largest Cities in the US


Comments
All Comments (0)
Join the conversation