Ever since the COVID-19 has become a global pandemic, people are staying at home and are doing digital transactions to avoid getting contaminated with the virus either with banknotes or with coins. This has helped the FinTech companies to grow in India in 2019 as well as in the first half of 2020.
UPI: What is it, its scams and why NPCI capped UPI transaction limit?
What are the FinTech Companies?
Financial Technology or FinTech companies are those that use technology to make financial services more efficient.
Due to the lockdown, curfew and fear of coming in contact with the virus, more and more people are registering on the digital payments platform. In addition to these, transaction from UPI (Unified Payments Interface), IMPS (Immediate Payment Service) and BHIM (Bharat Interface for Money) has been surging over the past three months.
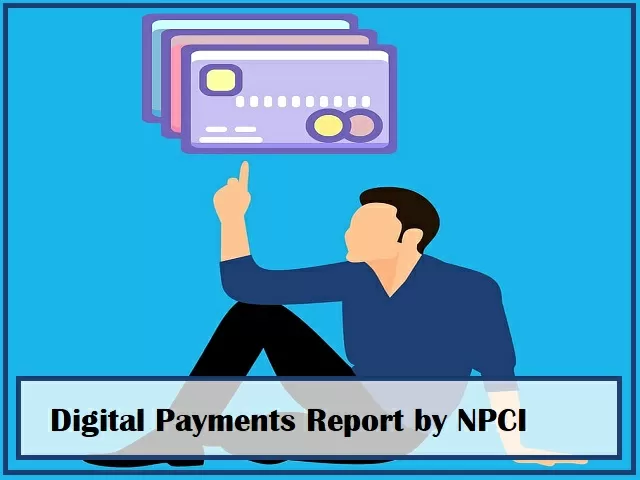
What does the report by NPCI state?
The report by NPCI (National Payments Corporation of India) states that in the month of July this year, the highest number of amount has been transferred via UPI-- Rs. 2,90,537.86 crore. Also, the volume of transactions was 149.73 crore-- the highest since the introduction of the interface.
Similarly, the amount transacted through BHIM was Rs. 6,395.75-- the highest since February 2020. IMPS also did a record transaction of Rs. 2,25,775.24 in July this year.
It is important to note that for the first time in the last quarter of 2019, the value of the card and mobile payments (Rs. 10.57 lakh crore) exceeded ATM withdrawals (Rs. 9.12 lakh crore). Also, the investments in the FinTech sector surged in 2019.
As per the current market trend, it can be assumed that the FinTech funding may touch new heights. However, in the second quarter of 2020 (April-June), there was a dip in the investments in FinTech start-ups as compared to the past nine quarters-- $184 million.
Transactions via UPI in 2020
| Month (year 2020) | Volume (in Million) | Amount (in Crore) |
| July | 1497.36 | 2,90,537.86 |
| June | 1336.93 | 2,18,391.60 |
| May | 1,234.50 | 2,18,391.60 |
| April | 999.57 | 1,51,140.66 |
| March | 1,246.84 | 2,06,462.31 |
| February | 1,325.69 | 2,22,516.95 |
| January | 1,305.02 | 2,16,242.97 |
Transactions via BHIM in 2020
| Month (year 2020) | Volume (in Million) | Amount (in Crore) |
| July | 16.02 | 6,395.75 |
| June | 14.68 | 6,047.08 |
| May | 13.7 | 5,488.69 |
| April | 11.17 | 4,028.93 |
| March | 17.05 | 6,049.18 |
| February | 18.4 | 6,524.11 |
| January | 18.54 | 6,611.22 |
Transactions via IMPS in 2020
| Month (year 2020) | Volume (in Million) | Amount (in Crore) |
| July | 222.1 | 2,25,775.24 |
| June | 198.91 | 2,06,950.80 |
| May | 166.68 | 1,69,401.68 |
| April | 122.47 | 1,21,140.79 |
| March | 216.82 | 2,01,961.70 |
| February | 247.8 | 2,14,565.66 |
| January | 259.53 | 2,16,810.70 |
Investments in FinTech start-ups
| Quarter | Deals | Amount ($M) |
| Q2 2020 | 23 | 184 |
| Q1 2020 | 24 | 385 |
| Q4 2019 | 29 | 311 |
| Q3 2019 | 36 | 621 |
| Q2 2019 | 29 | 309 |
| Q1 2019 | 37 | 287 |
Top FinTech Companies in India
1- Paytm
2- PhonePe
3- Mobikwik
4- PayU
5- PolicyBazaar
6- ETMoney
7- LendingKart
8- Freecharge
9- Mswipe
10- Ezetap
11- LoanTap
12- Billdesk
13- FINO PayTech
14- Capital Float
15- Pine Labs


Comments
All Comments (0)
Join the conversation