There are approximately 100 million people living in Bihar, a well-known Indian state that is situated in the country's north. In terms of population density, the state is second only to the union territory of New Delhi, with a density of about 1100 people per square kilometer. Its population has increased alarmingly in recent years, and numerous attempts to control has not yielded the best outcomes.
According to the 2011 Bihar Census, the state has the third-highest population in the nation, and its growth rate of 25% is higher than the roughly 17% national average. However, there were 124,919 people living in Bihar in 2022. And this indicates that Bihar's population grew at an average annual rate of 1.62% from 108,130 in 2013 to 124,919 in 2022.
Bihar Sex Ratio 2023
In Bihar, there are 918 women for every 1000 men, which is less than the national average of 940, according to the most recent census, which was conducted in 2011. Also, there were 919 more females than males in 2001.
Bihar Literacy Rate 2023
According to the most recent population census, Bihar's literacy rate is 61.80 percent, showing an upward trend. Out of that, 71.20 percent of men and 51.50 percent of women are literate. Bihar had a 47.00 percent literacy rate in 2001, with males and females having literate rates of 59.68 and 33.12 percent, respectively.
The actual number of literates in Bihar is 52,504,553, with males making up 31,608,023 and females 20,896,530. And the region with the highest rate of literacy is Rohtas, with 75.59%, and the region with the lowest rate is Purnia, with 52.49%.
Bihar Cabinet Ministers List 2023: Complete list of Bihar Ministers with Portfolios
Bihar Religion wise Population 2023
With 82.69% Hinduism dominates the state of Bihar. Whereas, Islam is the second most practiced religion, with 16.87% of the population. Buddhism is followed by 0.02%, Jainism by 0.02%, Sikhism by 0.02%, and Christianity by 0.12% in the state of Bihar.
| Religion | Population | Percentage | Males | Females |
| Hindu | 86,078,686 | 82.69 | 44,994,505 | 41,084,181 |
| Muslim | 17,557,809 | 16.87 | 9,044,086 | 8,513,723 |
| Christian | 129,247 | 0.12 | 66,115 | 63,132 |
| Sikh | 23,779 | 0.02 | 12,457 | 11,322 |
| Buddhist | 25,453 | 0.02 | 13,490 | 11,963 |
| Jain | 18,914 | 0.02 | 9,743 | 9,171 |
| Others | 13,437 | 0.01 | 6,833 | 6,604 |
| Not Stated | 252,127 | 0.24 | 130,928 | 121,199 |
Source: censusindia.gov.in
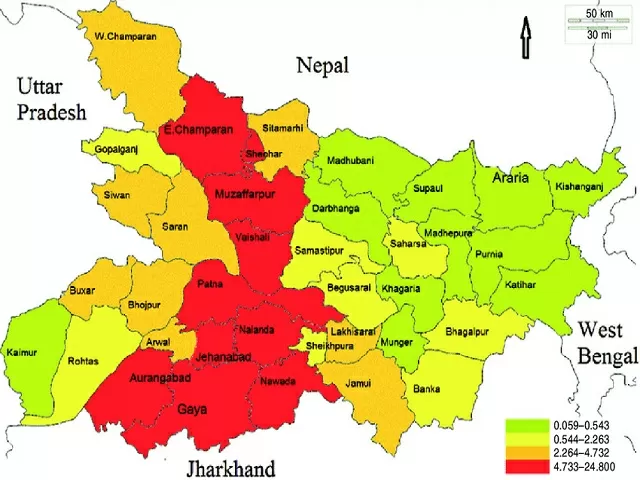
District-wise population in Bihar
Currently, Bihar State is divided into 38 districts, with an average population of 27,31,701. Patna, which has a population of 6,539,081, is the most populated district, while Sheikhpura, which has a population of 712,703, is the least populated. Population estimates for each district in Bihar from the 2011 Census and 2020.
| District | Population(2020 est.) | Population(2011) | Percentage |
| Pashchim Champaran | 4,485,948 | 3,935,042 | 3.78 |
| Purba Champaran | 5,813,283 | 5,099,371 | 4.90 |
| Sheohar | 748,120 | 656,246 | 0.63 |
| Sitamarhi | 3,902,874 | 3,423,574 | 3.29 |
| Madhubani | 5,115,612 | 4,487,379 | 4.31 |
| Supaul | 2,541,147 | 2,229,076 | 2.14 |
| Araria | 3,205,189 | 2,811,569 | 2.70 |
| Kishanganj | 1,927,056 | 1,690,400 | 1.62 |
| Purnia | 3,721,666 | 3,264,619 | 3.14 |
| Katihar | 3,500,973 | 3,071,029 | 2.95 |
| Madhepura | 2,282,009 | 2,001,762 | 1.92 |
| Saharsa | 2,166,754 | 1,900,661 | 1.83 |
| Darbhanga | 4,488,619 | 3,937,385 | 3.78 |
| Muzaffarpur | 5,473,211 | 4,801,062 | 4.61 |
| Gopalganj | 2,920,694 | 2,562,012 | 2.46 |
| Siwan | 3,796,729 | 3,330,464 | 3.20 |
| Saran | 4,505,123 | 3,951,862 | 3.80 |
| Vaishali | 3,984,324 | 3,495,021 | 3.36 |
| Samastipur | 4,858,185 | 4,261,566 | 4.09 |
| Begusarai | 3,386,417 | 2,970,541 | 2.85 |
| Khagaria | 1,900,250 | 1,666,886 | 1.60 |
| Bhagalpur | 3,463,053 | 3,037,766 | 2.92 |
| Banka | 2,319,630 | 2,034,763 | 1.95 |
| Munger | 1,559,252 | 1,367,765 | 1.31 |
| Lakhisarai | 1,141,040 | 1,000,912 | 0.96 |
| Sheikhpura | 725,430 | 636,342 | 0.61 |
| Nalanda | 3,280,524 | 2,877,653 | 2.76 |
| Patna | 6,655,850 | 5,838,465 | 5.61 |
| Bhojpur | 3,110,384 | 2,728,407 | 2.62 |
| Buxar | 1,945,241 | 1,706,352 | 1.64 |
| Kaimur (Bhabua) | 1,854,078 | 1,626,384 | 1.56 |
| Rohtas | 3,374,307 | 2,959,918 | 2.84 |
| Aurangabad | 2,895,683 | 2,540,073 | 2.44 |
| Gaya | 5,006,217 | 4,391,418 | 4.22 |
| Nawada | 2,529,826 | 2,219,146 | 2.13 |
| Jamui | 2,006,862 | 1,760,405 | 1.69 |
| Jehanabad | 1,282,857 | 1,125,313 | 1.08 |
| Arwal | 798,961 | 700,843 | 0.67 |
Source: censusindia.gov.in
Languages Spoken in Bihar
The majority of the population in the state of Bihar speaks Hindi, which is followed by Maithili (12.54%) and Urdu (8.4%). Despite speaking Maithili and Urdu, Hindi is the official and predominant language of all Biharis. In some Bihar districts, the Hindi dialects known as Bhojpuri, Angika, and Magahi are widely spoken. Other languages spoken by migrants, such as Bengali, Punjabi, and Gujarati, each have a population of under 1%.
| Languages | Population | Percentage | Rural | Urban |
| Hindi | 80,698,466 | 77.5205 | 71,381,862 | 9,316,604 |
| Maithili | 13,063,042 | 12.5486 | 12,395,984 | 667,058 |
| Urdu | 8,770,002 | 8.4246 | 7,122,078 | 1,647,924 |
| Bengali | 810,771 | 0.7788 | 734,058 | 76,713 |
| Santali | 458,949 | 0.4409 | 447,771 | 11,178 |
| Kurukh/Oraon | 87,995 | 0.0845 | 77,894 | 10,101 |
| Malto | 75,986 | 0.0730 | 75,900 | 86 |
| Punjabi | 10,467 | 0.0101 | 2,933 | 7,534 |
| Gujarati | 8,297 | 0.0080 | 6,711 | 1,586 |
| Nepali | 5,727 | 0.0055 | 3,840 | 1,887 |
| Sanskrit | 3,388 | 0.0033 | 3,041 | 347 |
| Odia | 3,188 | 0.0031 | 2,114 | 1,074 |
| Sindhi | 2,227 | 0.0021 | 1,041 | 1,186 |
| Assamese | 2,087 | 0.0020 | 1,447 | 640 |
Source: censusindia.gov.in
There were 21.24 million people in the Bihar state at the time of the first census taken under British rule in India in 1901. In the first-ever census conducted by Independent India in 1951, the population increased to 29 million. According to the 2001 census, the Bihari population had nearly tripled over the previous 50 years, reaching 82 million people. The population was estimated at 104 million people in the most recent census, which was conducted in 2011, representing a growth rate of 25% since the previous count. And for the recent data nation needs to wait till next year, as the year 2021 census is postponed until 2024.


-1764429046818.jpg)
Comments
All Comments (0)
Join the conversation