Statistics Notes: Statistics is a crucial field of study that helps students learn to collect, analyze, and interpret data, understand patterns, and draw meaningful conclusions. For students up to Class 12, mastering the fundamentals of statistics provides a solid foundation for various academic and real-world applications.
In this article, we have provided detailed notes on statistics, covering essential concepts and techniques to support effective learning and application. These notes have been crafted by subject matter experts and align with NCERT books to ensure accuracy and relevance.
Statistics Definition
Statistics is the branch of mathematics that deals with the collection, analysis, interpretation, presentation, and organization of data. It is a vital tool for understanding and interpreting data in various fields, including economics, psychology, business, and social sciences.
Key Concepts Related to Statistics
- Data: Raw information collected from various sources is the data.
- Population: The complete set of items or individuals being studied is termed as Population. Thus, it refers to the entire group being studied.
- Sample: A subset of the population selected for analysis is called Sample.
- Variable: Variables are the characteristics or attributes that can vary among subjects or individuals in a study.
Types of Data
1. Quantitative Data
It is the data that can be counted or measured in numerical values. Quantitative data is of two main types:
- Discrete Data: It consists of distinct, countable data represented by whole numbers. e.g., number of students.
- Continuous Data: It represents the data that can take any value within a range. g., temperature, height and weight.
2. Qualitative Data
The data representing information and concepts that are not represented by numbers is categorised under qualitative data. It describes qualities or characteristics of subjects. It is categorised into two types:
- Nominal Data: It is a type of data that is used to label variables without providing any quantitative value. e.g., symbols, words, letters, and the gender of a person.
- Ordinal Data: It a kind of data that groups variables into ordered categories. e.g., the level of education, the range of income, or the grades.
Data Collection
- Primary Data Collection: It is the process of gathering data directly from a first-hand source.
- Secondary Data Collection: It is the process of analyzing data already collected by someone else.
Methods of Data Collection
The most common data collection methods include:
- Surveys and Questionnaires
- Interviews
- Observations
- Experiments
Data Organization
Data can be organized using various methods:
- Frequency Distribution: A table that displays the frequency of various outcomes in a sample.
- Cumulative Frequency Distribution: Shows the cumulative frequencies for each class interval.
- Grouped Frequency Distribution: Data is grouped into intervals for easier analysis.
Measures of Central Tendency in a Data
A measure of central tendency is a single value that attempts to describe a set of data by identifying the central position within that set of data.
The three commonly used measures of central tendency are:
(i) Mean (Average): It is the sum of all observations divided by the number of observations.
![]()
Where,
- X is the sum of all observations
- N is the number of observations.
(ii) Median: It is the middle value in a dataset when the values are arranged in ascending or descending order.
- If N is odd: Median = Middle value
- If N is even: Median = Average of the two middle values
(iii) Mode: It is the most frequently occurring value in a dataset.
Measures of Dispersion
Measures of Dispersion measure the scattering of the data, i.e., they indicate the spread or variability of the data. It tells us how the values are distributed in the data set.
There are five most commonly used measures of dispersion:
1. Range: The difference between the highest and lowest values.
Range=Maximum−Minimum
2. Variance: Variance measures variability from the average or mean. It is calculated as follows:
![]()
3. Standard Deviation: It is the square root of the variance. It measures the variation of the data about the mean.
![]()
4. Mean Deviation: The average of the data's absolute deviation about the central points is termed as mean deviation. These central points could be the mean, median, or mode.
5. Quartile Deviation: The quartiles are values that divide a list of numbers into quarters and Quartile deviation is the half of the difference between the third quartile and the first quartile in a given data set.
Probability
Probability is the measure of the likelihood of an event occurring.
Basic Probability Formula
![]()
Probability and Statistics
Uncertainty and fluctuation across various fields and parameters can be effectively assessed through statistical analysis. Probability, a fundamental concept in statistics, plays a crucial role in quantifying these uncertainties. By analyzing probability, statisticians can make informed predictions and decisions based on the likelihood of different outcomes, thereby providing valuable insights into the variability and randomness inherent in data.
Probability Distributions
- Discrete Probability Distribution: Probability distribution for discrete variables. e.g., binomial distribution.
- Continuous Probability Distribution: Probability distribution for continuous variables. e.g., normal distribution.
Statistical Inference
Statistical inference is the theory of making decisions about population parameters by utilising sampling and the concept of probability.
Hypothesis
In order to make decisions it is useful to make some assumptions about the population. Such assumptions, which may or may not be true, are known as hypothesis.
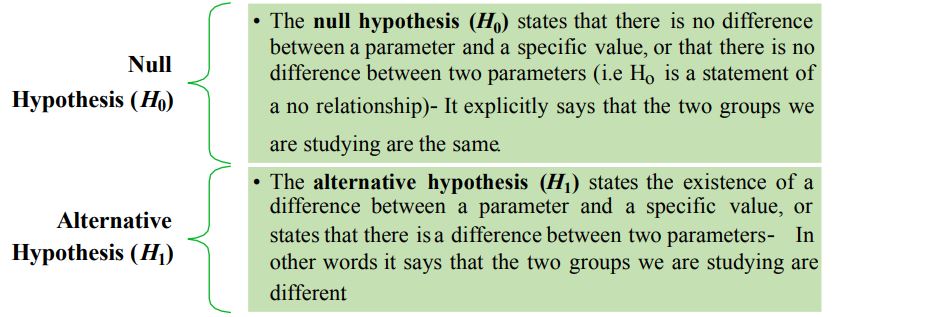
There are two types of statistical hypotheses for each situation: null hypothesis and alternative hypothesis.
1. Null Hypothesis (H0): The statement being tested, usually stating no effect or no difference.
2. Alternative Hypothesis (H1): The statement that there is an effect or a difference.
Check the following illustration for more detail:
Statistics is a powerful tool for analyzing and interpreting data, providing valuable insights across various fields. Mastery of the concepts and techniques outlined in these notes will equip students with the necessary skills to understand and apply statistical methods effectively, helping them excel in their examinations.
Also Check: Video Courses for PCMB (Class 10 and 12)
You can now access video lectures designed by experts for major topics of Physics, Chemistry, Maths and Biology to get a better concept clarity and achieve success in your academics. Find the video link below:


_-Schools-Closed-Tomorrow-in-THESE-States-Due-to-Weathe-1766046066202.jpg)


Comments
All Comments (0)
Join the conversation