In the Indian Premier League (IPL), maintaining a low economy rate is a significant achievement for bowlers. This metric reflects their ability to restrict the flow of runs, a crucial factor in the T20 format.
Among the best in IPL history, NB Singh from Gujarat Lions tops the list with an extraordinary economy rate of 3.75. He played just two matches in 2017, bowling four overs and conceding only 15 runs.
DJ Thornely, who represented the Mumbai Indians in 2008, followed with an economy rate of 5.71. In six matches, he bowled seven overs, conceding 40 runs and picking up three wickets.
Manhas, who played for multiple teams, including CSK, DC, and PWI, from 2008 to 2014, has an economy rate of 6.00 despite bowling just seven overs in his IPL career. These bowlers demonstrated impressive control and accuracy, making them the most economical in IPL history.
Check Out| Highest Successful Run Chases in IPL History (2008-2025)
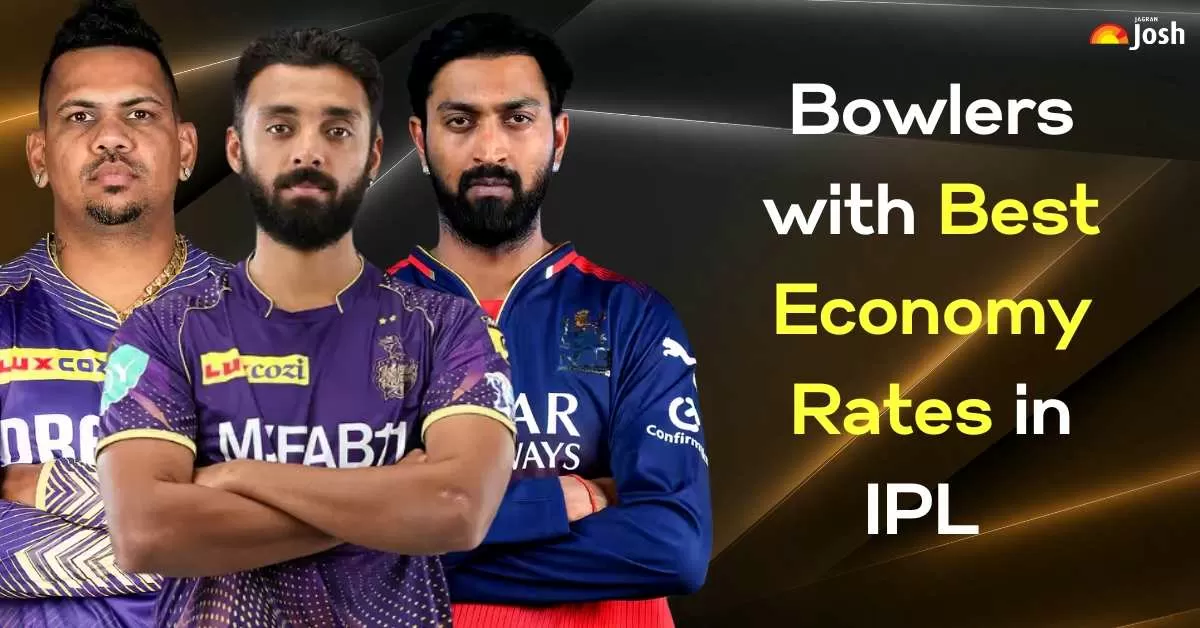
List of Top 10 Bowlers with the Best Economy Rates in IPL History
These active bowlers have left a significant mark in the IPL with their consistency and match-winning performances.
Sunil Narine (KKR) remains a game-changer, picking up 181 wickets with a stellar economy of 6.73, making him one of the most successful spinners in IPL history.
Krunal Pandya (LSG/MI/RCB) has contributed with 79 wickets, showcasing his utility as a reliable left-arm spinner. Ravichandran Ashwin (CSK/DC/KXIP/RPS/RR), known for his tactical off-spin, has scalped 181 wickets with a best of 4/34.
Varun Chakravarthy (KKR/KXIP) has been a key spinner, claiming 84 wickets with a best of 5/20. Ravindra Jadeja (CSK/GL/Kochi/RR), one of the most experienced all-rounders, has taken 160 wickets while maintaining an economy of 7.61.
Mitchell Santner (CSK/MI), though used sporadically, has been effective with 15 wickets at an economy of 7.06.
| Rank | Player Name | Teams | Span | Mat | Overs | Maidens | Wickets | BBl | Average | Economy |
| 1 | NB Singh | GL | 2017 | 2 | 4.0 | 0 | 1 | 1/7 | 15.00 | 3.75 |
| 2 | Dominic Thornely | MI | 2008 | 6 | 7.0 | 0 | 3 | 2/7 | 13.33 | 5.71 |
| 3 | Mithun Manhas | CSK/DC/PWI | 2008-2014 | 55 | 7.0 | 0 | 0 | - | - | 6.00 |
| 4 | Michael Clarke | PWI | 2012 | 6 | 11.0 | 0 | 2 | 1/12 | 33.50 | 6.09 |
| 5 | Ajit Chandila | RR | 2012-2013 | 12 | 39.0 | 0 | 11 | 4/13 | 22.00 | 6.20 |
| 6 | Matthew Short | PBKS | 2023 | 6 | 4.0 | 0 | 0 | - | - | 6.25 |
| 7 | Prashant Solanki | CSK | 2022 | 2 | 6.0 | 0 | 2 | 2/20 | 19.00 | 6.33 |
| 8 | Sohail Tanvir | RR | 2008 | 11 | 41.1 | 0 | 22 | 6/14 | 12.09 | 6.46 |
| 9 | Keshav Maharaj | RR | 2024 | 2 | 6.0 | 0 | 2 | 2/23 | 19.50 | 6.50 |
| 10 | Sachithra Senanayake | KKR | 2013 | 8 | 32.0 | 1 | 9 | 2/26 | 23.22 | 6.53 |
| 11 | Shaun Pollock | MI | 2008 | 13 | 46.0 | 1 | 11 | 3/12 | 27.36 | 6.54 |
| 12 | Anil Kumble | RCB | 2008-2010 | 42 | 160.5 | 1 | 45 | 5/5 | 23.51 | 6.57 |
| 13 | Fidel Edwards | DCH | 2009 | 6 | 23.2 | 1 | 5 | 2/27 | 30.80 | 6.60 |
| 14 | Glenn McGrath | DC | 2008 | 14 | 54.0 | 2 | 12 | 4/29 | 29.75 | 6.61 |
| 15 | Tyron Henderson | RR | 2009 | 2 | 6.0 | 0 | 1 | 1/30 | 40.00 | 6.66 |
What's Next| Who is the Most Expensive Player in IPL History?


-1767332640085.jpg)


Comments
All Comments (0)
Join the conversation